SimOps Simulator
Global air traffic is growing steadily. Already today, major airports are working at their capacity limits. The available space on the airways is also constantly decreasing due to the increase in traffic, so that considerable delays are already occurring during flights. Under these conditions, it is becoming increasingly difficult to draw up an economical flight plan, i.e. a flight plan with the highest possible productivity of the aircraft, in which the delays that occur are nevertheless kept within limits under as many external influences as possible.

The flight schedule and network optimization of a large airline with many connecting flights is a complex problem with many stochastic variables. Flight times depend on the weather conditions on the route, the runways selected in each case are determined by wind direction, among other factors, and delays during takeoff and landing depend on the load at the airports. In addition, flights are still interconnected by transferring passengers and crews.
With the help of event-oriented stochastic simulation, the entire flight network of an airline, including all relevant characteristics and operational processes, can be modeled and simulated. In this way, critical points in a flight plan can be identified and possible changes evaluated.
SimOps is currently being used at Lufthansa AG to analyze continental traffic.
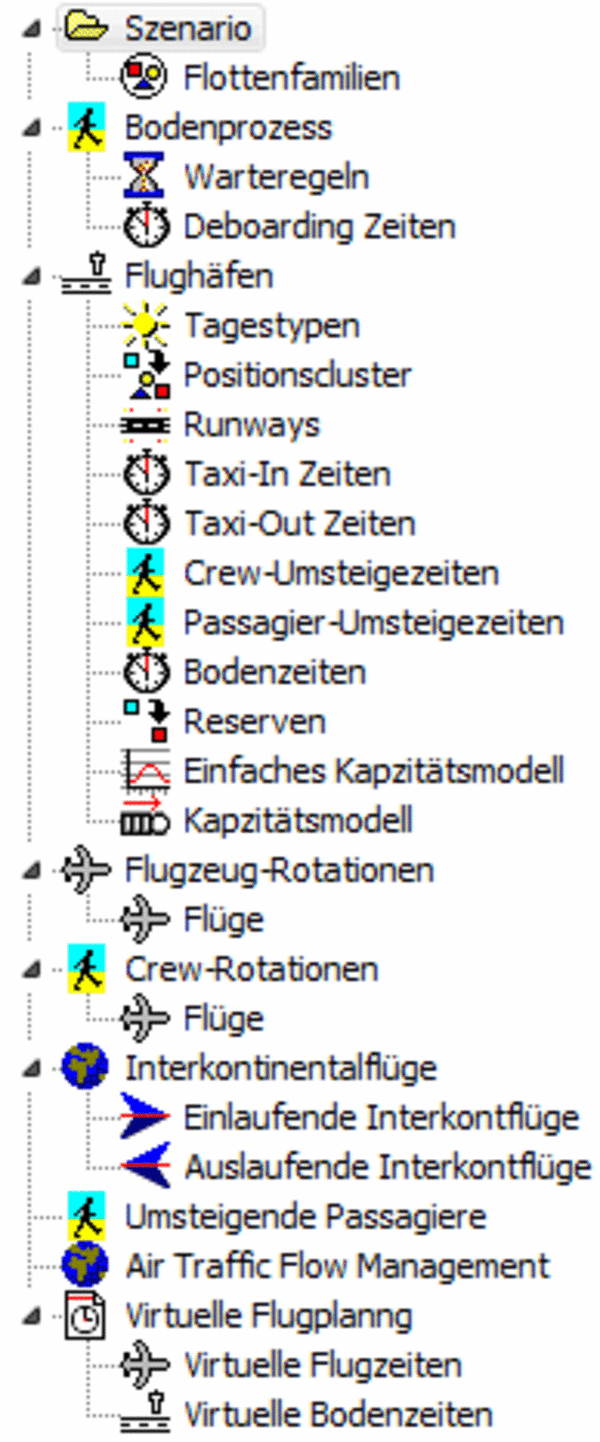
SimOps is an event-oriented simulation system for modeling flight networks including all flights, airports, crews and passengers. In the simulation model, the following properties are taken into account for each individual flight:
- Timely availability of the aircraft (possibly use of a reserve aircraft)
- Availability of crews (incl. consideration of the various attendance duties of cabin and cockpit crews as well as consideration of dead-head crews)
- Passenger availability (incl. waiting rules)
- ATFM delays of departures by routes, times and departure and destination airports
- Stochastic taxi-in and taxi-out times (depending on the selected parking position and taxiway as well as the aircraft type)
- Selection of taxiway according to wind direction and approach/departure direction
- Capacity model for simulating runway utilization
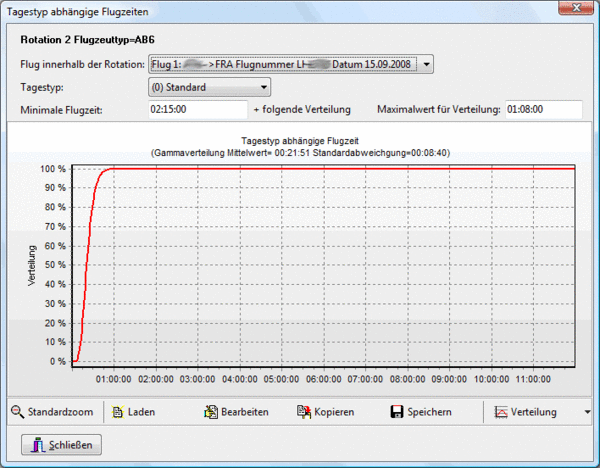
- Stochastic flight times, the distribution of which can also depend on weather conditions (clustering)
- Stochastic transfer times for crews and passengers depending on departure and destination gates
- Necessary ground times of aircraft (depending on airport and aircraft type)
The simulation model can thus be used to easily investigate the network-like consequences of individual delays and the effects of load shifts at individual airports.
Features
With the help of the SiimOps Simulator a complete air traffic network can be simulated on the computer.
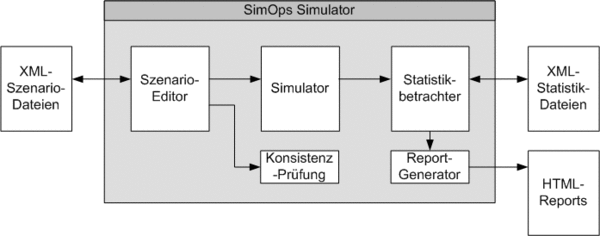
The SimOps Simulator offers appropriate interfaces to load and process a simulation model based on historical data. Since the simulation models themselves are stored in xml format, an easily automated intervention in the simulation process is possible at any time.

Data on all flights and airports are required for the simulation. In addition, information on the linkage of flights (transferring passengers and crews) is used. Depending on the specific problem, the simulation model can have different levels of detail at different points. Simulations with and without crews and passengers can be performed. (Also only partially available crew data can be used.) In the same way the airports can be designed in different details, e.g. the capacity model can be switched on and off separately for each airport and by fallback rules for cab and ground times also models can be simulated in which not all information for all aircraft types are available separately at all airports.
Simulation process
SimOps replicates the individual movements of aircraft, crews and passengers using event-oriented simulation. All relevant parameters of the system (i.e. all flights, all airports, all passengers as well as information related to routes and time segments) are continuously recorded. All data are stored in the form of mean value and standard deviation. In addition to the delays, the distributions as well as the punctuality at various thresholds are also recorded.
Performance
The simulator is designed for the simulation of complex flight networks (weekly flight schedules with more than 10,000 flights, over 100 airports and several 10,000 crew and passenger data records). Due to efficient memory usage, the simulator occupies only about 200 MB even in this case. Multi-core support allows SimOps to make optimal use of modern CPUs.
When simulating a complex weekly flight schedule (about 250 aircraft with 10,000 flights) on a modern CPU (Intel Core 2 Duo, 2.66 GHz), statistically stable results can be expected after a good minute.
Output of the results
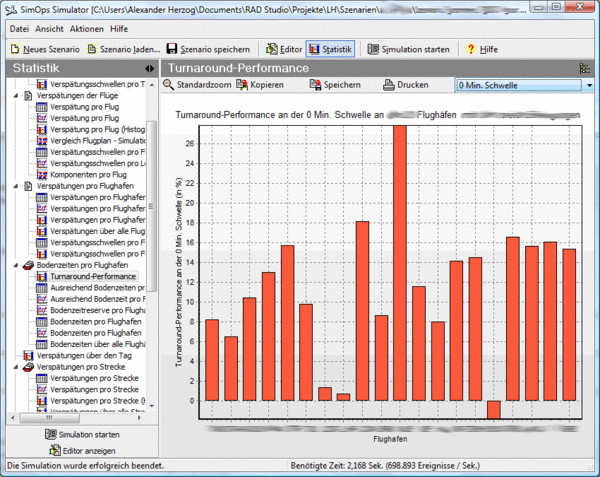
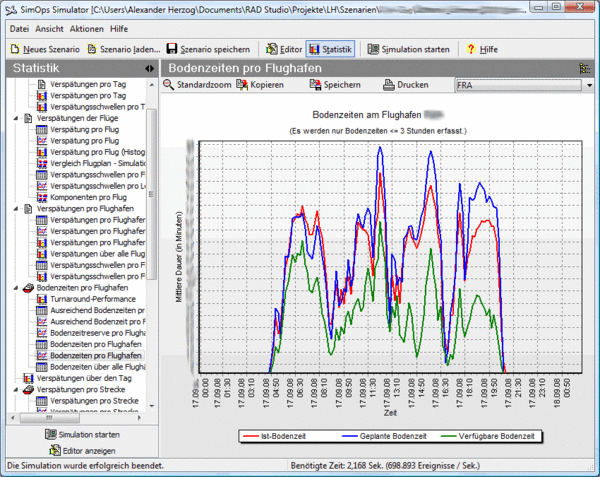
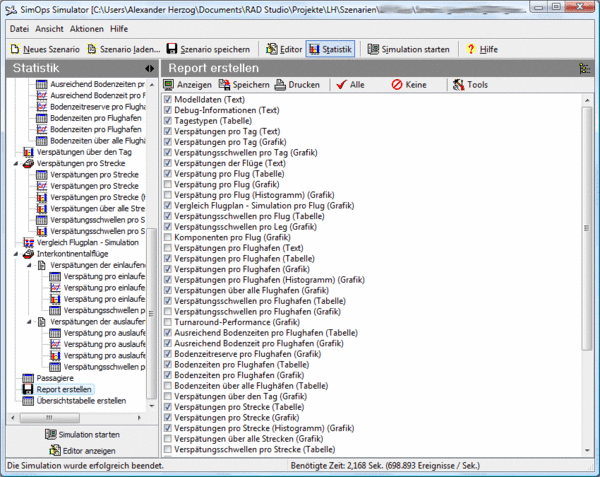
The results of the simulation are output in the form of tables and graphs. The results can be displayed directly in the simulator or made available as an html report or as an xml file for further processing by other programs.
The delay information is available per flight, per route, per airport and per half-hour interval. In addition to the mean value and standard deviation, the distributions of the delays are also made available in the form of a density as well as in the form of histograms. Furthermore, the respective punctuality at the usual thresholds (0 min, 3 min, 5 min and 15 min) is output.
Interfaces
SimOps can load simulation models from xml files. The structure of the files is documented in detail in the online help for the program and dtd files are available for machine syntax checking of scenario files. In addition, the names of the tags to be used within the xml files can be configured according to your own needs.
When editing a simulation scenario in the scenario editor, data for individual properties (e.g. base load values for a taxiway or empirically given flight time distributions) can be reloaded from csv files.
The simulation results can not only be viewed in the program or output in the form of html reports and csv tables, but can also be output collectively in the form of an xml file for further processing by other programs. The file format is documented in the same way as the format of the scenario files and can be configured in the same way.
Screenshots
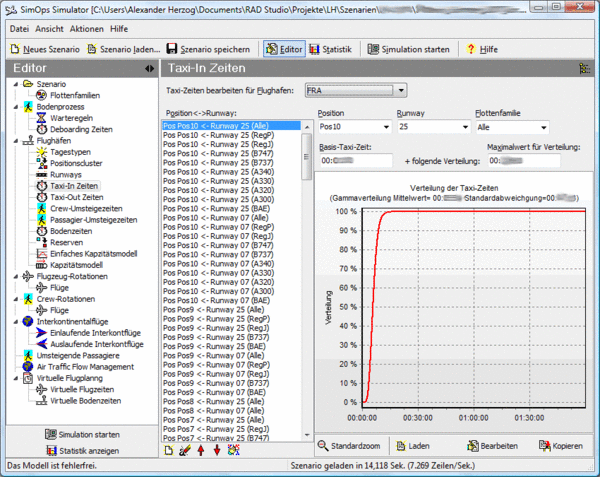
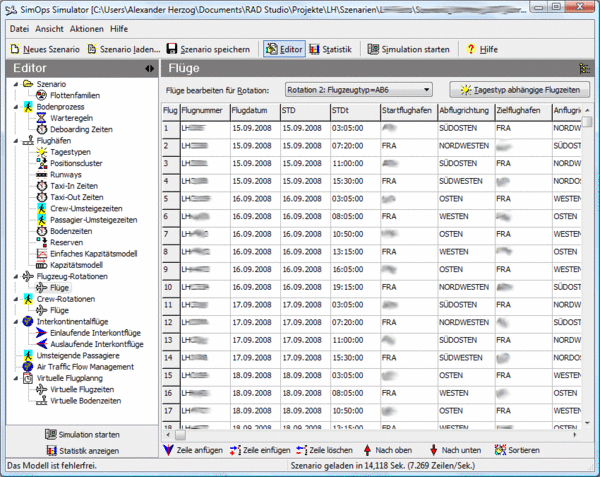
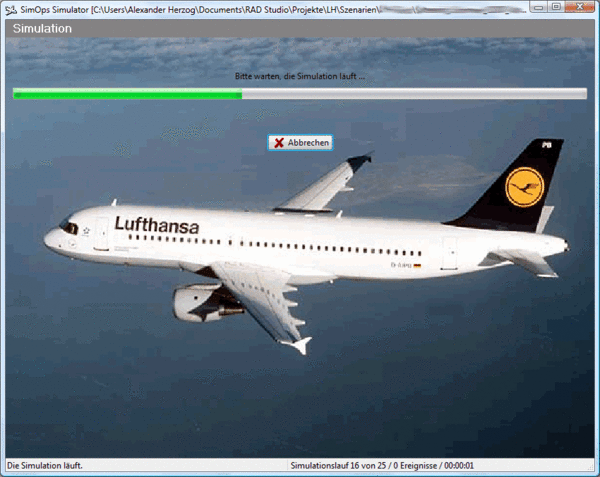
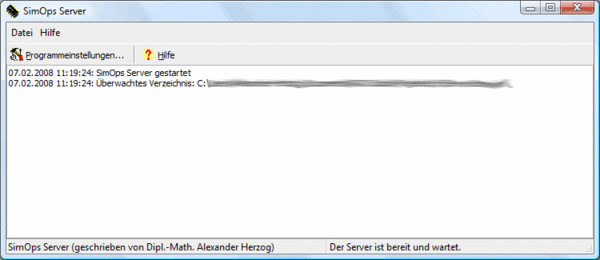
The following screenshots show how the model editor, simulation and statistics output of SimOps look in practice.
The individual images can be enlarged by clicking on them.

